
19 June 202630:30416 views on YouTubeWatch on YouTube
If you want to know how far you actually went, how fast you really were, or how long a battery lasts with a particular wing under the board, you need something logging GPS while you ride. The problem is that most of the obvious options were designed for people who are not standing in a lake with wet hands.
Why the Apple Watch stopped working out
The watch being replaced is a first generation Apple Watch, and the complaints are practical rather than snobbish. Its battery had degraded to the point where it would not survive a full session, so rides ended up half logged or not logged at all. Even when new it did not do much more than a day on a charge. Worst of all for this use, a wet face means you cannot operate it, which is a real design problem on a board. Getting GPX data off it is also awkward enough that a third party export app is recommended if you stick with one.
What the Instinct 3 does better
The replacement is a Garmin Instinct 3 Solar in the 45mm size, sent by Garmin. Three things make it suit this sport. It has physical buttons, so wet fingers are irrelevant. It charges from sunlight, and after logging rides it was still showing more than eighteen days of remaining charge, which raises the genuine possibility of rarely plugging it in at all. And the GPS looks more accurate than what came before, based on the speeds coming out of it. There is no eFoiling activity profile in the list, so rides get logged as kiteboarding, which carries distance and speed and is close enough. The face can be configured to show speed, distance, time, heart rate or a mix, which matters when you want a glance mid-ride. The one reservation raised is wanting a bigger display for reading speed while riding.
Getting the GPX off and logging the ride
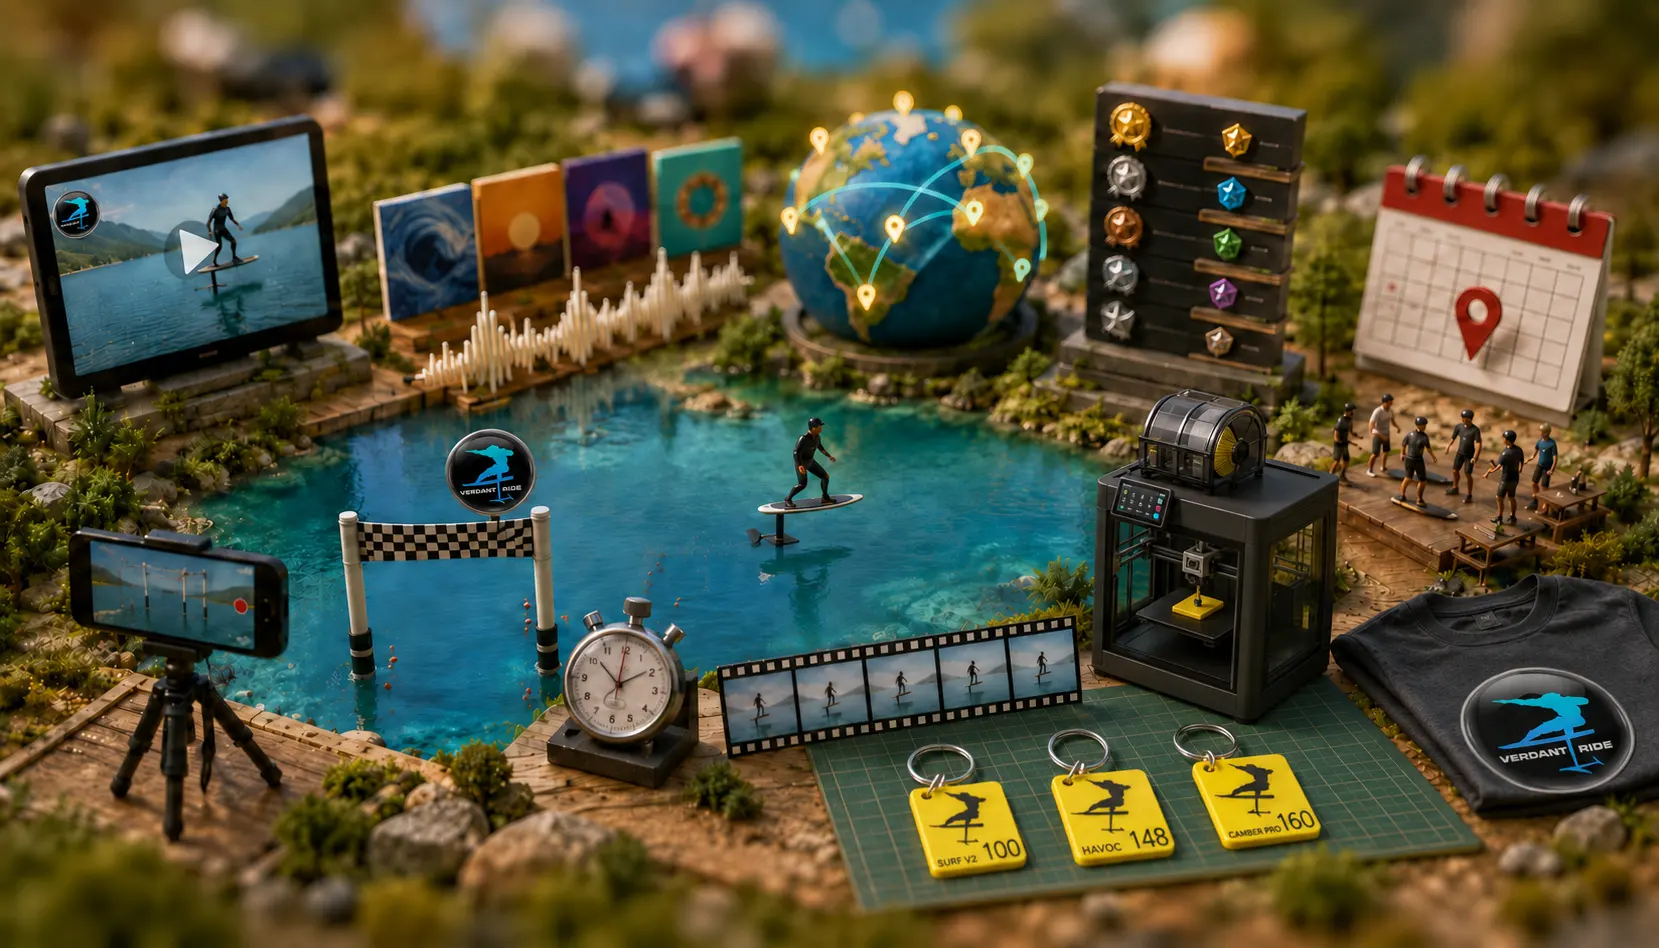
Export runs through Garmin Connect: open the activity, choose export, pick GPX. That file goes straight into the ride logging tool on this site, which reads it and fills in distance, duration, average and top speed rather than making you type a form, and it accepts a batch of files at once if you have a backlog. The sample session in the episode comes out at a little over four miles, averaging 22 to 23 mph, with a top speed of 27.6 mph. Logged rides feed a community map, and the privacy design is worth knowing: your position is deliberately randomised by several kilometres, and randomised further where dots cluster, so the map shows roughly where people ride and what they ride without exposing anyone’s launch spot.
Turning the data into an on screen speedometer
The last section covers Verdant Speed, a free tool that takes the same GPX file and renders a speedometer overlay you can drop over your footage, with your own choice of colours and fonts. It works with GPX from any source. The practical tip for lining it up is to start your watch on camera, so there is a visible or audible marker in the footage, then time stretch the overlay in your editor so its start and end match. Do that and the numbers on screen match what you were actually doing, with no subscription video software required.
Chapters
- 00:00 Why I needed a new ride tracker (RIP, Apple Watch)
- 01:30 Logging a ride on the Garmin (physical buttons!)
- 03:18 A word from our sponsor: BAWLS (code RIDE) + the taste challenge
- 05:48 Viewer question: "How do I log a ride?" (thanks, Sharman)
- 06:43 Garmin Instinct 3 first impressions: solar, battery, vs Apple Watch
- 11:00 Exporting GPX from Garmin Connect
- 14:00 Logging the ride on the website
- 17:00 The community ride map (and how your spot stays private)
- 25:00 Verdant Speed: free on-screen speedometer overlay + final verdict
Subscribe on YouTube Every episode
Keep watching



Read more on this
- Sorting Garbage and Filtering NoiseAug 25, 2026
- Verdant Ride Launches: The Complete eFoil Resource HubSep 2, 2026
- Label EverythingAug 21, 2026